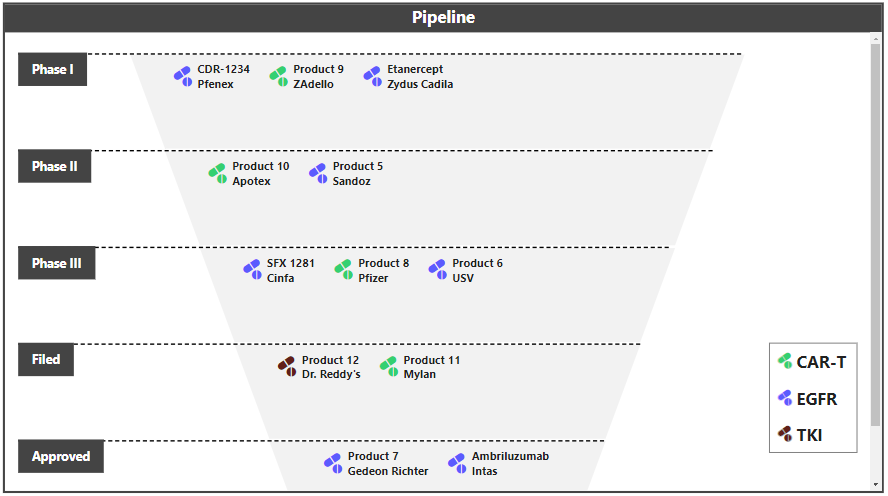
Pipeline is a Power BI custom visual.
Pipeline is a type of chart which used to represent the products that falls under different phases of
manufacturing.
Key Features
Pipeline chart shows the products falls under different phases.
It Supports random colors for MoA
It Supports Legend
Support
If you have any issues or questions, please send an email to Support Team